Page 1 sur 17 12311 ... DernièreDernière
Affiche les résultats de 1 à 10 sur 169

Sujet : Origine du Japonais

  1. #1
    Member
    Inscrit
    décembre 2005
    Messages
    39
    Merci
    0
    Remercié 0 Fois dans 0 Messages

    Par défaut Origine du Japonais

    Desolee d'ecrire en anglais, but my french is so bad, so I hope you excuse me to write in English, if not in japanese.

    Salut, Mon Ami

    I don't know how many people here are really interested in who the
    japanese people really are. But since this is the forum about japan,
    I think it nice idea to post some recent
    scientific study concerning japanese people.

    The stated conclustion from many various studies is:

    (1) 60-70% of Japanese population are actually from Korea
    (2) 30-40% of Japanese population are native islanders from northern sibelia

    I am planning to post some genetic studies to show that the statement above is true.
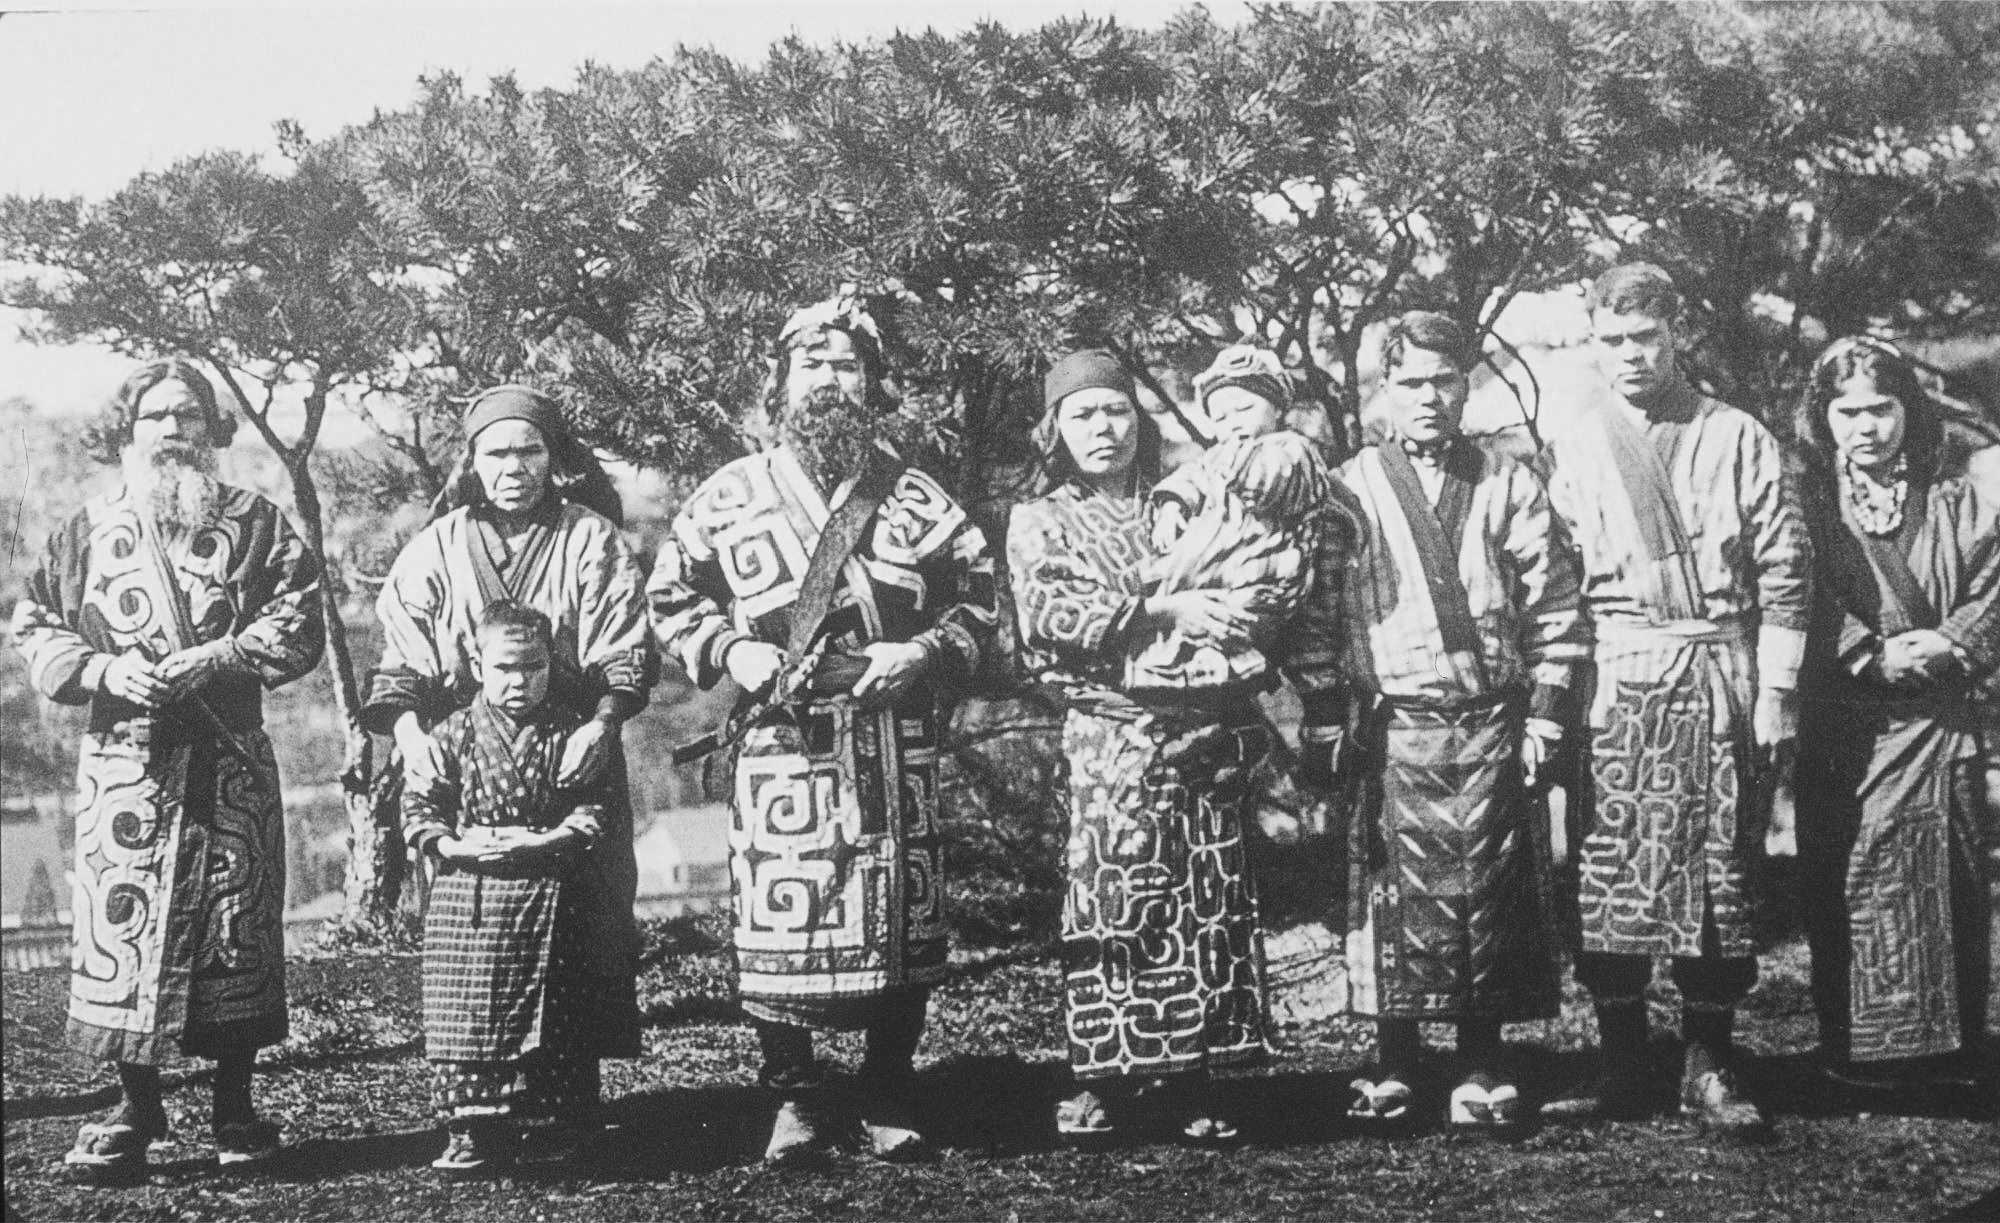
    I will then talk about the facial structure of Japanese people in relation to Korean and Chinese. Lastly, I will post some pictures of Japanese People so that you could see the morphological differences between the groups.

    -------------------
    : J Hum Genet. 2000;45(2):76-83. Related Articles, Links

    Y chromosomal DNA variation in east Asian populations and its potential for inferring the peopling of Korea.

    Kim W, Shin DJ, Harihara S, Kim YJ.

    Department of Biology, Dankook University, Cheonan, Choong-Nam, Republic of Korea. wookkim@ansco.dankook.ac.kr

    We have examined variations of five polymorphic loci (DYS287, DXYS5Y, SRY465, DYS19, and DXYS156Y) on the Y chromosome in samples from a total of 1260 males in eight ethnic groups of East Asia. We found four unique haplotypes constructed from three biallelic markers in these samples of East Asians. The Japanese population was characterized by a relatively high frequency of either the haplotype I-2b (-/Y2/T) or II-1 (+/Y1/C). These dual patterns of the distribution of Y chromosomes (I-2b/II-1) were also found in Korea, although they were present at relatively low frequencies. The haplotype II-1 was present in Northeast Asian populations (Chinese, Japanese, Koreans, and Mongolians) only, except for one male from the Thai population among the Southeast Asian populations (Indonesians, Philippines, Thais, and Vietnamese). The Japanese were revealed to have the highest frequency of this haplotype (27.5%), followed by Koreans (2.9%), Mongolians (2.6%), and mainland Chinese (2.2%). In contrast, the frequency of the haplotype I-2b was found to be 17.1% in the Japanese, 9.5% in Indonesian, 6.3% in Korean, 3.8% in Vietnamese, and 2.7% in Thai samples. These findings suggested that the chromosomes of haplotype I-2b were likely derived from certain areas of Northeast Asia, the region closest to Southeast Asia. Phylogenetic analysis using the neighbor-joining tree also reflected a general distinction between Southeast and Northeast Asian populations. The phylogeny revealed a closer genetic relationship between Japanese and Koreans than to the other surveyed Asian populations. Based on the result of the dual patterns of the haplotype distribution, it is more likely that the population structure of Koreans may not have evolved from a single ancient population derived from Northeast Asians, but through dual infusions of Y chromosomes entering Korea from two different waves of East Asians.

    PMID: 10721667 [PubMed - indexed for MEDLINE]


    Fig. 2 Distribution of Y haplogroups in east Asia. Circle area is proportional to sample size, and the nine haplogroups are represented by different colors

    The distribution of Y-chromosomal variation surveyed here reveals significant genetic differences among east Asian populations. Haplogroup DE-YAP (the YAP+ allele) was present at high frequency only in the Japanese and was rare in other parts of east Asia (Table 2, Fig. 2). This result is consistent with previous findings of YAP+ chromosomes only in populations from Japan and Tibet in east Asia (Hammer and Horai 1995; Hammer et al. 1997; Kim et al. 2000; Tajima at al. 2002). However, haplogroup DE-YAP is also found at low frequencies in all the other northeast Asian populations sampled here (2.4% overall, excluding the Japanese; 9.6%, including the Japanese), but only in two of the southern populations (0.8% overall), suggesting that the Korean YAP+ chromosomes are unlikely to have been derived from a southeast Asian source. The prevalence of the YAP+ allele in central Asian populations suggests a genetic contribution to the east Asian populations from the northwest, probably from central Asia (Altheide and Hammer 1997; Jin and Su 2000; Karafet et al. 2001).

    Haplogroups C-RPS4Y711 and K-M9 were widely but not evenly distributed in the east Asian populations. Haplogroup C-RPS4Y711 appears to be the predominant northeast Asian haplogroup, with high frequencies in Mongolians (Buryats, 37.3%; Khalkhs, 42.9%) and Manchurians (22.7%; Table 2, Fig. 2). The moderate frequency of haplogroup C-RPS4Y711 Y-chromosomes in Korea (15.0%) implies a genetic influence from northern populations of east Asia, starting possibly in east Siberia. Su and Jin (2001) suggest that the RPS4Y711-T chromosome originated in east Asia, probably in the southeast, and then expanded to the north (Siberia), based on the genetic diversity of Y-STR markers. However, the observed low Y-STR diversity of haplogroup C-RPS4Y711 chromosomes in their surveys of Siberian and central Asian populations compared with east Asian populations could also be explained by a more northern (Mongolian and/or Siberian) origin followed by genetic drift resulting from small effective population sizes (Pakendorf et al. 2002). Recently, Cavalli-Sforza and Feldman (2003) have suggested that haplogroup C-RPS4Y711 expanded both through a southern route from Africa (e.g., India) to Oceania, and a northern one to Mongolia, Siberia, and eventually to northwest America. Further genetic surveys are required to test these hypotheses, with additional markers and more samples from diverse regions of Asia.
    In contrast, M9-G Y-chromosomes show an opposing distribution to those carrying RPS4Y711-T in east Asia: they are more frequent in southern populations than in northern ones, showing a clinal variation from about 90% to 60% (Table 1). The haplogroups carrying the M9-G mutation and additional sublineages of M9-G in Korea appear to be at an intermediate frequency (81.9%) between southeast and northeast Asian populations. This result implies that the Korean population may be influenced by both the northeast and southeast Asian populations. Even within haplogroup O, the most frequent Korean STR haplotype (23-10-13 with the markers DYS390-DYS391-DYS393, 19% of haplogroup O; Table 3) is the most frequent in the Philippines (27%), whereas the second most frequent Korean haplotype (24-10-12, 16%) is the most frequent in Manchuria (45%). Thus, the distribution of haplogroups K-M9 and C-RPS4Y711 may reflect dispersals from both north and south. The settlement of each region at different times needs to be considered in order to understand the peopling of east Asia. Recently, Karafet et al. (2001) have noted that realistic explanations for the peopling of east Asia have to accommodate more complex multidirectional biological and cultural influences than earlier models have allowed.


    Fig. 3 Principal components (PC) analysis of haplogroup frequencies in 11 east Asian populations (circle Koreans, open diamonds southeast populations, closed diamonds northeast populations)


    In this study, the Koreans appear to be most closely related overall to the Manchurians among east Asian ethnic groups (Fig. 2), although a principal components analysis of haplogroup frequencies reveals that they also cluster with populations from Yunnan and Vietnam (Fig. 3). The genetic relationship with Manchuria is consistent with the historical evidence that the Ancient Chosun, the first state-level society, was established in the region of southern Manchuria and later moved into the Pyongyang area of the northwestern Korean Peninsula. Based on archeological and anthropological data, the early Korean population possibly had a common origin in the northern regions of the Altai Mountains and Lake Baikal of southeastern Siberia (Han 1995; Choi and Rhee 2001). Recent studies of mtDNA (Kivisild et al. 2002) and the Y-chromosome (Karafet et al. 2001) have also indicated that Koreans possess lineages from both the southern and the northern haplogroup complex. In conclusion, the peopling of Korea can be seen as a complex process with an initial northern Asian settlement followed by several migrations, mostly from southern-to-northern China.[/img]

  2. #2
    Member
    Inscrit
    décembre 2005
    Messages
    39
    Merci
    0
    Remercié 0 Fois dans 0 Messages

    Par défaut

    http://www.journals.uchicago.edu/AJH.../42338/42338.h tml
    Y-Chromosome Evidence of Southern Origin of the East AsianSpecific Haplogroup O3-M122

    Hong Shi,1,2,6 Yong-li Dong,3 Bo Wen,4 Chun-Jie Xiao,3 Peter A. Underhill,5 Pei-dong Shen,5 Ranajit Chakraborty,7 Li Jin,4,7 and Bing Su1,2,7

    1Key Laboratory of Cellular and Molecular Evolution, Kunming Institute of Zoology and 2Kunming Primate Research Center, Chinese Academy of Sciences, 3Key Laboratory of Bio-resources Conservation and Utilization and Human Genetics Center, Yunnan University, Kunming, China; 4State Key Laboratory of Genetic Engineering and Center for Anthropological Studies, School of Life Sciences, Fudan University, Shanghai; 5Department of Genetics, Stanford University, Stanford, CA; 6Graduate School of Chinese Academy of Science, Beijing; and 7Center for Genome Information, University of Cincinnati, Cincinnati

    Received March 14, 2005; accepted for publication June 29, 2005; electronically published July 14, 2005.

    The prehistoric peopling of East Asia by modern humans remains controversial with respect to early population migrations. Here, we present a systematic sampling and genetic screening of an East Asianspecific Y-chromosome haplogroup (O3-M122) in 2,332 individuals from diverse East Asian populations. Our results indicate that the O3-M122 lineage is dominant in East Asian populations, with an average frequency of 44.3%. The microsatellite data show that the O3-M122 haplotypes in southern East Asia are more diverse than those in northern East Asia, suggesting a southern origin of the O3-M122 mutation. It was estimated that the early northward migration of the O3-M122 lineages in East Asia occurred 25,00030,000 years ago, consistent with the fossil records of modern humans in East Asia.

    It should be noted that when we discuss the origin and migration of human populations, a time periodwhich part of the human-population history is under scrutinyshould be clearly defined. Recent population movement and admixture could wipe out or significantly diminish the original genetic signatures of early population movements. Therefore, to extract information for modern human origin and early population movements that happened before the Neolithic period, population-specific markers, such as SNP markers on the Y chromosome, become useful for the study of regional population movements (Jobling and Tyler-Smith 2003). At the same time, recent gene flow between distantly related populations can also be identified and removed in an analysis based on population specificity. Hence, in this sense, extreme caution should be exercised in selection of genetic markers in the study of the origin and early migrations of a continental population, because genetic variations introduced through recent gene flow could create false interpretations, as in two previous studies (Ding et al. 2000; Karafet et al. 2001). The same logic also applies to the selection of populations; ethnic populations with long histories of inhabitation in a region are always preferred for inferring early population histories.

    In East Asian populations, there are three regionally distributed (East Asianspecific) Y-chromosome haplogroups under the M175 lineage (fig. 1)O3-M122, O2-M95, and O1-M119together accounting for 57% of the Y chromosomes in East Asian populations (table 1). The O3-M122 has the highest frequency (41.8% on average) (fig. 2) in East Asians, especially in Han Chinese (52.06% in northern Han and 53.72% in southern Han) (table 1), and it is absent outside East Asia. Previous studies have shown that O2-M95 and O1-M119 are prevalent in SEAS and probably originated in the south (Su et al. 1999, 2000a; Wen et al. 2004a, 2004b) (table 1). Therefore, tracing the origin of O3-M122 became critical for a full understanding of the origin and early migrations of modern East Asians.

    The frequency distribution of the O3-M122 haplotypes in East Asian and other continental populations. The data used were from published studies (Su et al. 1999, 2000a, 2000b; Qian et al. 2000; Semino et al. 2000; Underhill et al. 2000; Karafet et al. 2001; Lell et al. 2002; Jin et al. 2003; Wen et al. 2004a).

  3. #3
    Member
    Inscrit
    décembre 2005
    Messages
    39
    Merci
    0
    Remercié 0 Fois dans 0 Messages

    Par défaut

    http://mbe.oxfordjournals.org/cgi/co...ull/19/10/1737
    Free Online Journal Edition

    The Emerging Limbs and Twigs of the East Asian mtDNA Tree
    Toomas Kivisild*, Helle-Viivi Tolk*, Jüri Parik*, Yiming Wang, Surinder S. Papiha, Hans-Jürgen Bandelt and Richard Villems*

    *Department of Evolutionary Biology, Tartu University and Estonian Biocentre, Estonia;
    Department of Medical Genetics, Sun Yat-Sen University of Medical Sciences, People's Republic of China;
    Department of Human Genetics, University of Newcastle-upon-Tyne;
    Department of Mathematics, University of Hamburg, Germany

    We determine the phylogenetic backbone of the East Asian mtDNA tree by using published complete mtDNA sequences and assessing both coding and control region variation in 69 Han individuals from southern China. This approach assists in the interpretation of published mtDNA data on East Asians based on either control region sequencing or restriction fragment length polymorphism (RFLP) typing. Our results confirm that the East Asian mtDNA pool is locally region-specific and completely covered by the two superhaplogroups M and N. The phylogenetic partitioning based on complete mtDNA sequences corroborates existing RFLP-based classification of Asian mtDNA types and supports the distinction between northern and southern populations. We describe new haplogroups M7, M8, M9, N9, and R9 and demonstrate by way of example that hierarchically subdividing the major branches of the mtDNA tree aids in recognizing the settlement processes of any particular region in appropriate time scale. This is illustrated by the characteristically southern distribution of haplogroup M7 in East Asia, whereas its daughter-groups, M7a and M7b2, specific for Japanese and Korean populations, testify to a presumably (pre-)Jomon contribution to the modern mtDNA pool of Japan.


    Fig. 3.—Phylogenetic reconstruction and geographic distribution of haplogroup M7. a, A network of HVS-I haplotypes, which comprises the superposition of the most parsimonious trees for the three postulated sets of M7a, M7b, and M7c sequences. The mutations along the bold links were only analyzed for a few Japanese sequences (Ozawa et al. 1991 ; Ozawa 1995 ; Nishino et al. 1996 ) and—toward the root of M—for some Chinese sequences (this study): the corresponding individuals with (partial) coding region information are boxed. Numbers along links indicate transitions; recurrent HVS-I mutations are underlined. The age of mtDNA clades is calculated (along the tree indicated by unbroken lines) according to Forster et al. (1996) , with standard errors estimated as in Saillard et al. (2000) . Sample codes (and sources): AI—Ainu (Horai et al. 1996 ); CH—Chinese (Betty et al. 1996 ; Nishimaki et al. 1999 ; Qian et al. 2001 ; Yao et al. 2002 ; this study); IN—Indonesian (Redd and Stoneking 1999 ); JP—Japanese (Ozawa et al. 1991 ; Ozawa 1995 ; Horai et al. 1996 ; Nishino et al. 1996 ; Seo et al. 1998 ; Nishimaki et al. 1999 ); KN—Koreans (Horai et al. 1996 ; Lee et al. 1997 ; Pfeiffer et al. 1998 ); MA—Mansi (Derbeneva et al. 2002 ); MJ—Majuro (Sykes et al. 1995 ); MO—Mongolians (Kolman, Sambuughin, and Bermingham 1996 ); PH—Philippines (Sykes et al. 1995 ; Maca-Meyer 2001 ); RY—Ryukyuans (Horai et al. 1996 ); SB—Sabah (Sykes et al. 1995 ); TW—Taiwanese Han (Horai et al. 1996 ) and aboriginals (Melton et al. 1998 ); UI—Uighur (Comas et al. 1998 ; Yao et al. 2000 ); YA—Yakuts (Derenko and Shields 1997 ). b, Frequencies of the subgroups of M7 in Asian populations are inferred from the preceding HVS-I as well as partial HVS-I and RFLP data (VN—Vietnamese: Ballinger et al. 1992 ; Lum et al. 1998 ). Mainland Han Chinese are denoted as follows: GD—Guangdong, LN—Liaoning, QD—Qingdao, WH—Wuhan, XJ—Xinjiang, YU—Yunnan (Yao et al. 2002 ), SH—Shanghai (Nishimaki et al. 1999 ). The number of M7 sequences in relation to the sample size is indicated under each pie slice proportional to the M7 frequency

    Fig. 2. Frequency distributions of the eight Y-chromosome haplotypes for the 14 global populations, with their approximate geographic locations. The frequencies of the eight haplotypes are shown as colored pie charts (for color codes, see upper left insert). JP =Japanese. Han=Chinese

    Only four Japanese populations exhibited ht1 (defined only by YAP+) at various frequencies (also see Table 1). The highest frequency (87.5%) was found in JP-Ainu, followed by JP-Okinawa (55.6%) living in the southwestern islands of Japan, JP-Honshu (36.6%), and JP-Kyushu (27.9%). The ht2 haplotype (defined by YAP+/M15+) was found in only two males, one each from Thais and Thai-Khmers; ht3 (defined by YAP+/SRY4064-A) was completely absent in the Asian populations examined, whereas Jewish in the Uzbekistan and African populations had this haplotype with a frequency of 28.3% and 100%, respectively. Thus, the YAP+ lineage was found in restricted populations among Asian populations, consistent with previous reports (Hammer and Horai 1995; Hammer et al. 1997; Shinka et al. 1999).

    The ht4 haplotype (defined only by M9-G) was widely distributed among north, east, and southeast Asian populations, except for the Ainu. This haplotype was frequent (60.5%) in overall Asian populations (Table 1). Among them, the Han Chinese and southeast Asian populations were characterized by high frequencies ranging from 81.0% to 96.0%. In contrast to ht4, ht5 (defined by M9-G/DYS257108-A) and ht6 (defined by M9-G/DYS257108-A/SRY10831-A) were small contributors to Asian populations. The highest frequency of ht5 was observed in Nivkhi (19.0%) and that of the ht6 in Thai-Khmers (10.8%). The ht5 haplotype is widely distributed among European, Asian, and Native American populations and is proposed to be one of the candidates for founder haplotypes in the Americas (Karafet et al. 1999). Furthermore, high frequencies of ht6 were observed in north Europe, central Asia, and India (Karafet et al. 1999). Thus, the presence of ht5 in Nivkhi may account for the founder effect of peopling of the Americas.

    The ht7 haplotype (defined by RPS4Y-T) was also widely distributed throughout Asia with the exceptions of Malaysia and the Philippines, whereas this was absent in two non-Asian populations. The highest frequency of ht7 was found in Buryats (83.6%), followed by Nivkhi (38.1%). Thus, the geographic distribution of ht7 in Asia appears to contrast with that of ht4.

    Only eight individuals (1.4%) in Asia belonged to ht8, which was the major haplotype in Jewish population (Table 1). The ht8 haplotype may not be useful for inferring population relatedness among Asian populations because it is defined by no mutations. Additional Y-polymorphic markers such as M89 and M168 (Underhill et al. 2000; Ke et al. 2001) will be needed to investigate details of the formation of modern Asian population.

  4. #4
    Member
    Inscrit
    décembre 2005
    Messages
    39
    Merci
    0
    Remercié 0 Fois dans 0 Messages

    Par défaut

    According to genetic results, apporx. 60% or more Japanese are of continental origin (korean/chinese). However, there are significant jomon/ainu bloods in them.

    I think on average, japanese appearances are nowhere in east asian.
    My guess is due to the the distorsion introduced by jomon/ainu bloods, and their unique facial structures. I guess, there must be some japanese who could be almost deemed as chinese or korean, but there are japanese who is completely outside the chinese/korean facial features.

    ---------------
    http://www-personal.une.edu.au/~pbrown3/brown99.pdf

    The first modern East Asians ?:
    another look at Upper Cave
    101, Liujiang and Minatogawa 1
    Peter Brown
    Department of Archaeology and Palaeoanthropology
    University of New England
    Armidale, NSW 2351, Australia


    MINATOGAWA 1
    The Minatogawa 1 male skeleton was found in 1970 at the
    Minatogawa limestone quarry on Okinawa (Suzuki and Hanihara 1982).
    111
    The first modern East Asians?: another look at Upper Cave 101, Liujiang and Minatogawa 1
    Three female skeletons, in varying states of preservation, and assorted
    other fragments were also recovered. The Minatogawa skeletons have
    been described in detail in Suzuki and Hanihara (1982), with Suzuki
    (1982) describing the crania. Additional comparative information can
    be found in Baba and Nerasaki (1991). The Minatogawa 1 cranium is
    not as complete as Liujiang and Upper Cave 101, particularly in the
    basi-cranium, facial skeleton and temporal regions. Several of the
    dimensions used in the analysis to follow had to be estimated.
    Unlike Liujiang and Upper Cave there does not appear to have
    been any concern over the reliability of the dating of Minatogawa.
    Radiocarbon dates of 18,250 ±650 to 16,600 ±300 years BP were obtained
    from charcoal inside the fissure (Kobayashi et al. 1974). Fluorine content
    of human and non-human bones within the site suggested that they
    were contemporaneous (Matsu’ura 1982). Assuming that the site was
    well stratified, that the carbon dates do bracket the skeletons and that
    the skeletons were not intrusive, then Minatogawa remains do have a
    strong claim to being the earliest modern human skeletons in East Asia.


    Overall, the scatter plot of Functions 1 and 2 indicate the relative morphological
    similarity of the modern and Neolithic Chinese groups, while the
    modern Japanese are closer to a wider range of East Asian and Native
    American populations. Plots of the total group dispersions associated
    with Figure 3 revealed the large degree of overlap between the Neolithic
    and modern Chinese and between the modern Japanese, Anyang,
    Hainan and Native American groups. The Eskimo and Ainu were more
    distinct, as were both of the Australian Aboriginal groups.

    Please note that northern and southern japanese are in the middle point between N/S chinese and ainu/jomon/minatogawa. This represents the japanese population
    divided into the two completely diverged skull/facial structures.

  5. #5
    Member
    Inscrit
    décembre 2005
    Messages
    39
    Merci
    0
    Remercié 0 Fois dans 0 Messages

    Par défaut

    I presume that on the northernmost japan (aomori, akita, etc), people's face can have many features like ainu, jomon, minatogawa, but no chinese like facial structures could be expected, because of the genetic distributions of YAP+ and DE-YAP and some mtDNA markers. The rest will be defined as yayoi coming from the continent through korean peninsula.


    The results show the average faces of east asian (and some other related)populations.

    Please notice that N/S japanese faces are slightly different from N/S chinese. I think this is due to the ainu/jomon population and/or mixtures of both natives and continentals.

    Northern chinese are independent of modern yayoi japanese facial structures. Southern chinese are somewhat similar, so the southern chinese tribes may have immigrated to japan through korea 2kya, which now comprises the 60% of total japanese population.

    Please note the ainu/jomon (native japanese islanders) which should represent roughly 40% or less of total japanese population (by the results of genetic analysis) shows dissimilarity to the Northern/Southern chinese.

  6. #6
    Member
    Inscrit
    décembre 2005
    Messages
    39
    Merci
    0
    Remercié 0 Fois dans 0 Messages

    Par défaut

    So what does Ainu and Northern Japanese really look like?

    Superficially, we have to consider the representative of the population rather than averaging out. I think the person from the noble family seems to be the most suitable sample for dissecting the phenotype of northern japanese. This is due to the traditional japanese system that samurai or any noble class belong to the lords so the number of years these lords govern means that the samurai under the hierachy has lived with them for similar number of years.

    Mutsu Munemitsu, A minister of Foreign Affair


    He is nothern japanese from the noblest family in northern japan.
    His family tree is from Hiraizumi-Fujiwara clan (Emishi related Ainu).
    His ancestor includes some figures like Date Masamune, and the origin of family dates back more than 1000 years ago,

    The same person


    Terada Manabu, Politician, Born in Akita, Nothernmost Japan

    (second person from the left. )

    He is born in Northernmost Japan, and likely to be Ainu related. His
    background is upper middle class.

  7. #7
    Member
    Inscrit
    décembre 2005
    Messages
    39
    Merci
    0
    Remercié 0 Fois dans 0 Messages

    Par défaut

    Now, having said about the nothern japanese (northern can be replaced by northernmost). I would like to mention about the southernmost japanese.
    They are known to be related to Ryukyuan/Okinawan, and their phenotypes seem to be fairly ainu, but they seem to be mixed with continentals, so they show more varieties. Prime Minister Koizumi's family comes from the noble family in Kagoshima-ken, and he belongs to this class of people.

    Togo Heihachiro, An admiral, A national hero in Japan-Russo War (no involvement in WWII)


    Southernmost Japanese. His ancestor was a neighbor of koizumi's.

    Togo Heihachiro in his 58 years old


    Okubo Toshimichi, Revolutionary, A founder of Meiji Government
    Born in Kagoshima, Southernmost Japan

    He is the suppoter of domestic development and resisted the
    "Conquering of Korea".

    He suppressed regional rebellions by the former
    samurai class that ended with the Satsuma Rebellion,
    but was assassinated by a former samurai in 1878.

    His background is middle-ranking samurai, and his phenotype
    seems to be from the relation to Ryukyuan, native islanders.

    The same person

  8. #8
    Member
    Inscrit
    décembre 2005
    Messages
    39
    Merci
    0
    Remercié 0 Fois dans 0 Messages

    Par défaut

    Komura Jutaro, Minister of Foreign Affair, Harvard Graduate


    Akiyama Saneyuki, Hero in Japan-Russo, he retired immediately after the war, and commited suicide


    Akiyama Yoshifuru, General, The founder of Japanese Cavalry


    Last two people are southern-central (shikoku) japanese. I posted this because their phenotype is somewhere between japanese and korean, mixed. Very interesting

    The first pic of komura can be representative of any japanese, but his background seems to be jomon.

    Gotoda Masazumi, LDP party member, politician. Born in Tokushima, Shikoku, southern japan


    He is the 16th of his family tree, Gotoda. His family has been the wealthiest, but not noble, in Shikoku, Southern Japan. Because of geographical location of his famiily, he is likely to be jomon related.

  9. #9
    Member
    Inscrit
    décembre 2005
    Messages
    39
    Merci
    0
    Remercié 0 Fois dans 0 Messages

    Par défaut


    Group of Ainu people, 1904 photograph, taken in Hokkaido Japan

    From Wikipedia "Ainu People"
    Due to intermarriage with the Japanese and ongoing absorption into the predominant culture, few living Ainu settlements exist. Many "authentic Ainu villages" advertised in Hokkaido are simply tourist attractions.

    If you search the Ainu people over the Web, you will most likely see the fake Ainu people's picture.

  10. #10
    Member
    Inscrit
    décembre 2005
    Messages
    39
    Merci
    0
    Remercié 0 Fois dans 0 Messages

    Par défaut

    Let's now look at Korean population given our choice of samples from the northern and southern Japanese

    Average (not necessarily typical) Korean face

    http://www.andongkim.com/articles/20...koreanface.htm

    Korean scientists allegedly produced what they call, "the average Korean face". The Korean Institute of Science and Technology information (KISTI) working together with the Catholic Institute for Applied Anatomy made computer tomographic scans of Koreans last year and with the aid of a supercomputer produced a "digital Korean" -- a 3-D video of the average Korean's physical structure.

    Do you see much differences from the northen japanese?


sujet d'information

Utilisateur(s) parcourant ce sujet

il y a actuellement 1 utilisateur(s) parcourant ce sujet. (0 membres et 1 visiteurs)

Sujets similaires

  1. Tsuba ORIGINE d'un TSUBA de KATANA
    Par Heisenberg dans le forum Katana et Autres questions
    Réponses: 4
    Dernier message: 10/06/2010, 17h42
  2. Divers Origine
    Par asagiri dans le forum Cuisine - Restaurants
    Réponses: 5
    Dernier message: 21/10/2009, 13h27
  3. Traduction Jp -> Fr Origine de prénoms ?
    Par Babalou dans le forum Traductions
    Réponses: 0
    Dernier message: 02/05/2009, 14h54
  4. Divers Transversalité des arts martiaux d'origine japonaise ...
    Par shihonage dans le forum Arts martiaux
    Réponses: 9
    Dernier message: 20/07/2006, 00h39
  5. Origine de prénom
    Par Alex44 dans le forum Questions générales de japonais
    Réponses: 5
    Dernier message: 06/07/2005, 19h52

Règles des messages

  • Vous ne pouvez pas créer de sujets
  • Vous ne pouvez pas répondre aux sujets
  • Vous ne pouvez pas importer de fichiers joints
  • Vous ne pouvez pas modifier vos messages
  •  
  • Les BB codes sont Activés
  • Les Smileys sont Activés
  • Le BB code [IMG] est Activé
  • Le code [VIDEO] est Activé
  • Le code HTML est Désactivé